The Strait of Hormuz, Explained for Investors
One in five barrels of oil on Earth passes through a 21-mile-wide waterway between Iran and Oman. The complete investor's guide to the world's most important chokepoint: how it works, what history shows, and how the risk reaches your portfolio.

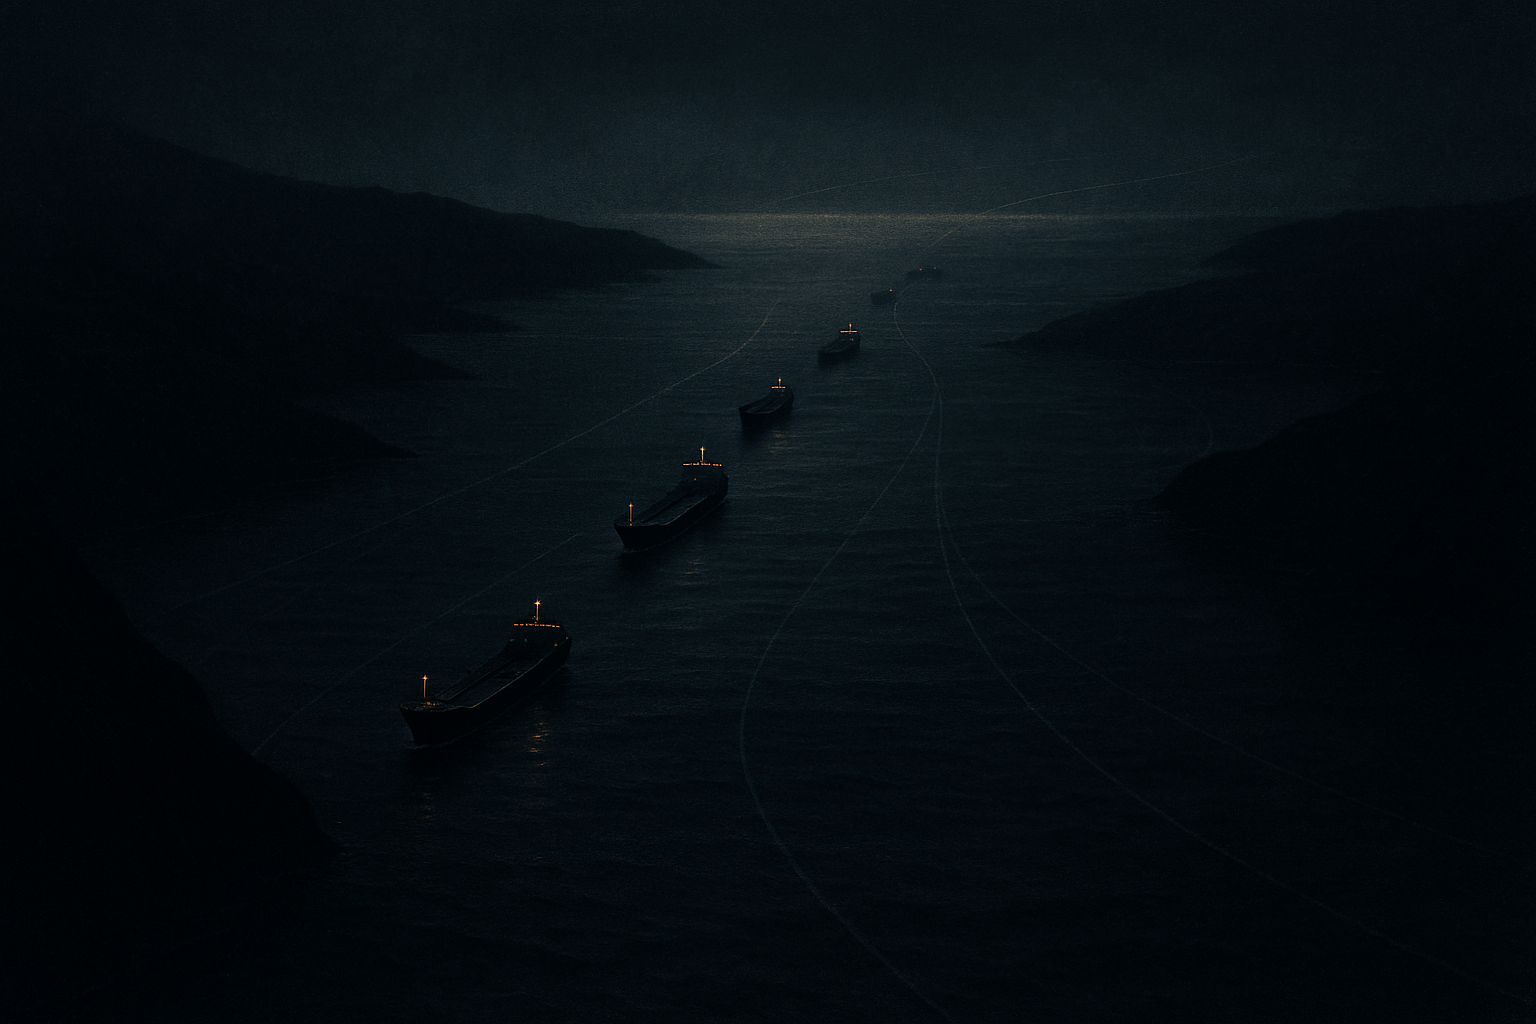
Roughly one out of every five barrels of oil consumed on Earth passes through a waterway about 21 nautical miles wide at its narrowest point. The inbound and outbound shipping lanes are each about two miles across. One coastline belongs to Oman and the United Arab Emirates. The other belongs to Iran.
That is the Strait of Hormuz, and if you invest in anything, anywhere, it prices risk into your portfolio whether you think about it or not. When tensions rise in the Gulf, the strait is the reason a conflict thousands of miles away shows up in your gas price, your airline ticket, your bond yields, and eventually your central bank's next decision.
This is the reference guide: what the strait is, why it cannot be replaced, what actually happens to markets when it comes under threat, and how investors have historically thought about positioning around it. Bookmark it. The strait is never in the news just once.
What the Strait of Hormuz actually is
The strait connects the Persian Gulf to the Gulf of Oman and the open ocean. Every barrel exported by sea from Saudi Arabia's Gulf terminals, Iraq, Kuwait, Qatar, Bahrain, and most of the UAE has to pass through it. So does nearly all of Qatar's liquefied natural gas, which by itself is roughly a fifth of the world's LNG supply.
The US Energy Information Administration has long described Hormuz as the world's most important oil transit chokepoint, with flows in recent years running around 20 million barrels of crude, condensate, and refined products per day. That is approximately 20 percent of global petroleum liquids consumption and around a quarter or more of all seaborne oil trade.
Two numbers explain why the strait is a permanent feature of risk pricing rather than an occasional one:
- The vast majority of that oil goes to Asia. China, India, Japan, and South Korea buy most Hormuz-transiting crude. A disruption is not a Middle East story or even an American story. It is a global industrial input story.
- The bypass capacity is a fraction of the flow. Saudi Arabia's East-West pipeline can move several million barrels a day to the Red Sea, and the UAE's pipeline to Fujairah adds capacity that loads outside the strait. Together they can reroute only a minority of normal Hormuz volumes, and the pipelines themselves are targets in any real conflict, as attacks on Saudi pumping infrastructure have demonstrated more than once.
There is no version of the modern energy system that routes around Hormuz. That is the whole point.
A short history of the strait moving markets
Every generation of investors relearns Hormuz. The pattern repeats.
The Tanker War, 1984 to 1988. During the Iran-Iraq War, hundreds of commercial vessels were attacked in the Gulf. The US Navy ended up escorting reflagged Kuwaiti tankers, and the period produced the largest US naval surface engagement since World War II. Shipping kept moving, but insurance costs and freight rates repriced the entire oil trade for years.
The 2019 season. Tankers were sabotaged near Fujairah, others were seized, and a drone and missile attack temporarily knocked out roughly half of Saudi Arabia's processing capacity at Abqaiq. Crude posted its largest single-day percentage spike in decades. The lesson: even without closing the strait, credible threats to Gulf energy infrastructure can move the oil price double digits in hours.
The Red Sea rerouting, 2023 to 2025. Not Hormuz, but the modern template for what chokepoint stress does: attacks on shipping pushed war-risk insurance premiums up by an order of magnitude, forced thousands of voyages onto longer routes, and quietly fed freight costs into global inflation for over a year.
2026. As of this writing, the strait is under the most sustained pressure in its modern history: strikes on tankers, an announced exclusion zone, record-high freight rates for Gulf loadings, and a war-risk insurance market quoting transit cover at levels that were unthinkable two years ago. Brent crude crossed $100 for the first time since 2022. We have been covering the financial mechanics in real time, including how the shadow fleet reshapes sanctions enforcement and what the escalation does to Fed policy and positioning.
The transmission mechanism: how a strait becomes your portfolio's problem
When Hormuz risk rises, the repricing moves through markets in a reasonably predictable sequence.
First: insurance and freight. War-risk premiums are quoted as a percentage of a ship's hull value per transit. In calm times that number is a rounding error. Under threat it can rise by a factor of ten or more, and some underwriters simply decline coverage. Freight rates follow, because fewer owners are willing to load in the Gulf. This happens within days, sometimes hours, and it is the purest real-time gauge of how seriously the shipping market takes a threat. Watch tanker rates before you watch pundits.
Second: the crude curve. Spot prices rise faster than long-dated futures, steepening backwardation. The market is saying: barrels today are scarce, barrels in two years are probably fine. The size of that front-end premium is the market's estimate of disruption probability multiplied by severity.
Third: refined products and cracks. Diesel and jet fuel, the workhorse fuels of freight and aviation, typically tighten hardest. Refining margins widen in regions that lose access to Gulf crude grades.
Fourth: the macro layer. Sustained oil above the economy's comfort zone becomes an inflation problem, which becomes a central bank problem. A supply-driven oil shock is the worst kind for policymakers: raising rates does not produce more barrels, but not raising them lets inflation expectations slip. That tension, oil strength forcing hawkish policy into a slowing economy, is historically where equity drawdowns come from in chokepoint crises. It is exactly the configuration markets are wrestling with now.
Fifth: the currency and haven layer. The dollar usually firms, gold catches the geopolitical bid, and oil-importing emerging markets see their currencies and bonds pressured. Exporters like Canada and Norway see the opposite.
Can Iran actually close the strait?
The honest answer from decades of naval analysis: closing it completely is very hard, but Iran does not need to close it to move the price.
Iran's tools are mines, anti-ship missiles, drones, fast-attack boats, and the ability to harass or seize individual vessels. Against that stands the US Fifth Fleet based in Bahrain and a standing international interest, including China's, in keeping oil flowing. A full closure would cut off Iran's own exports and invite a response that Tehran has historically avoided.
But markets do not price binary outcomes, they price probabilities and costs. A strait that is 90 percent open with tankers taking fire is still a repriced strait. Insurance, freight, and crude all carry the risk premium even when the oil keeps flowing. The relevant investor question is never "will it close." It is "what does each week of elevated threat add to the cost of moving energy, and who captures or pays that cost."
The investor playbook, historically
None of this is a recommendation. It is a map of how capital has typically behaved in past Hormuz episodes, and the categories worth understanding before the next one.
- Tanker owners are the most direct and fastest-moving expression. Fewer willing ships plus war-risk costs mean spot rates can multiply. The trade is violent in both directions: rates collapse the moment de-escalation looks credible.
- Integrated oil majors and Gulf-independent producers capture higher prices with diversified, mostly unthreatened production. Companies whose barrels never see Hormuz effectively receive the risk premium for free.
- Refiners are mixed: crude costs rise, but product cracks often widen. Geography decides the winners.
- Gold and havens respond to the same impulse. In episodes where oil strength collides with rate uncertainty, gold has often outperformed its usual rate sensitivity, a dynamic we covered in the silver market's structural squeeze as well.
- Defense and security names reprice on the recognition that Gulf air defense, naval escort, and counter-drone demand is structural, not episodic.
- The losers are systematic: airlines, shipping-dependent consumer businesses, oil-importing emerging markets, and long-duration growth equities if the shock feeds into yields.
The consistent historical mistake is treating chokepoint spikes as instantly mean-reverting. Some are: one-off incidents fade in weeks. But when the underlying conflict is persistent, the premium compounds instead of decaying, and the "buy the dip in risk, sell the oil spike" reflex loses money. Distinguishing an incident from a regime is the actual analytical work, and it is most of what we do here.
The questions investors ask about Hormuz
How much oil goes through the Strait of Hormuz? Around 20 million barrels per day of crude and products in recent years, roughly a fifth of world consumption, per the US Energy Information Administration, plus about a fifth of global LNG.
What happens to oil prices if the strait is disrupted? Partial disruptions and credible threats have historically added anywhere from a few dollars to double-digit percentage moves within days. Full-closure scenarios in bank research have ranged far higher, but a full closure has never happened, including during the Tanker War.
Why can't pipelines replace it? Existing bypass pipelines can carry only a minority of normal Hormuz flows, and they concentrate risk in a handful of pumping stations that have themselves been attacked.
What is the fastest indicator to watch? War-risk insurance quotes and Gulf tanker spot rates. They reprice before equities and often before crude itself.
This is the first entry in AlphaBriefing's Chokepoint series: reference guides to the geographic pressure points that price global markets. The next time Hormuz is in the headlines, you will already know what it means.
Get the next briefing free in your inbox: Join AlphaBriefing
Sources & Further Reading
- US Energy Information Administration — Strait of Hormuz World Oil Transit Chokepoint analysis
- AlphaBriefing — The Shadow Fleet Is Winning
- AlphaBriefing — Top 10 Stocks We're Watching, Fed Week Edition
- AlphaBriefing — Silver Lost Its Biggest Buyer and the Shortage Got Worse
- AlphaBriefing — Beijing Didn't Come to the Summit to Give Up Its Best Card
Disclaimer
AlphaBriefing is an independent intelligence publication. The content in this article is produced for informational and educational purposes only. Nothing published by AlphaBriefing constitutes financial, investment, legal, tax, or regulatory advice, nor should it be construed as a solicitation or recommendation to buy, sell, or hold any security, asset, or financial instrument.
All views expressed are those of the author at the time of writing and are subject to change without notice. Markets are volatile and unpredictable; past performance is not indicative of future results. Any investment involves risk, including the possible loss of principal.
AlphaBriefing and its principals, employees, or contributors may hold positions in securities or assets mentioned in this article. This should be considered a potential conflict of interest. No material relationship with any company referenced exists unless explicitly disclosed. Readers should conduct their own due diligence and consult qualified financial, legal, and tax advisors before making any investment decisions.
Information in this article is drawn from public sources believed to be reliable at the time of publication. AlphaBriefing makes no warranty, express or implied, as to the accuracy, completeness, or timeliness of any information herein. AlphaBriefing accepts no liability for any loss or damage arising from reliance on this content.
© AlphaBriefing. All rights reserved. Unauthorized reproduction or distribution is prohibited.