Silver Is Front-Running a Rate Cut the Fed Says Isn't Coming
Gold set the record, but silver is the trade. After a hawkish Fed hold and a run of soft data, the precious complex is front-running an easing cycle nobody on the committee will admit is coming — and the gold/silver ratio at 68 is the coiled spring.

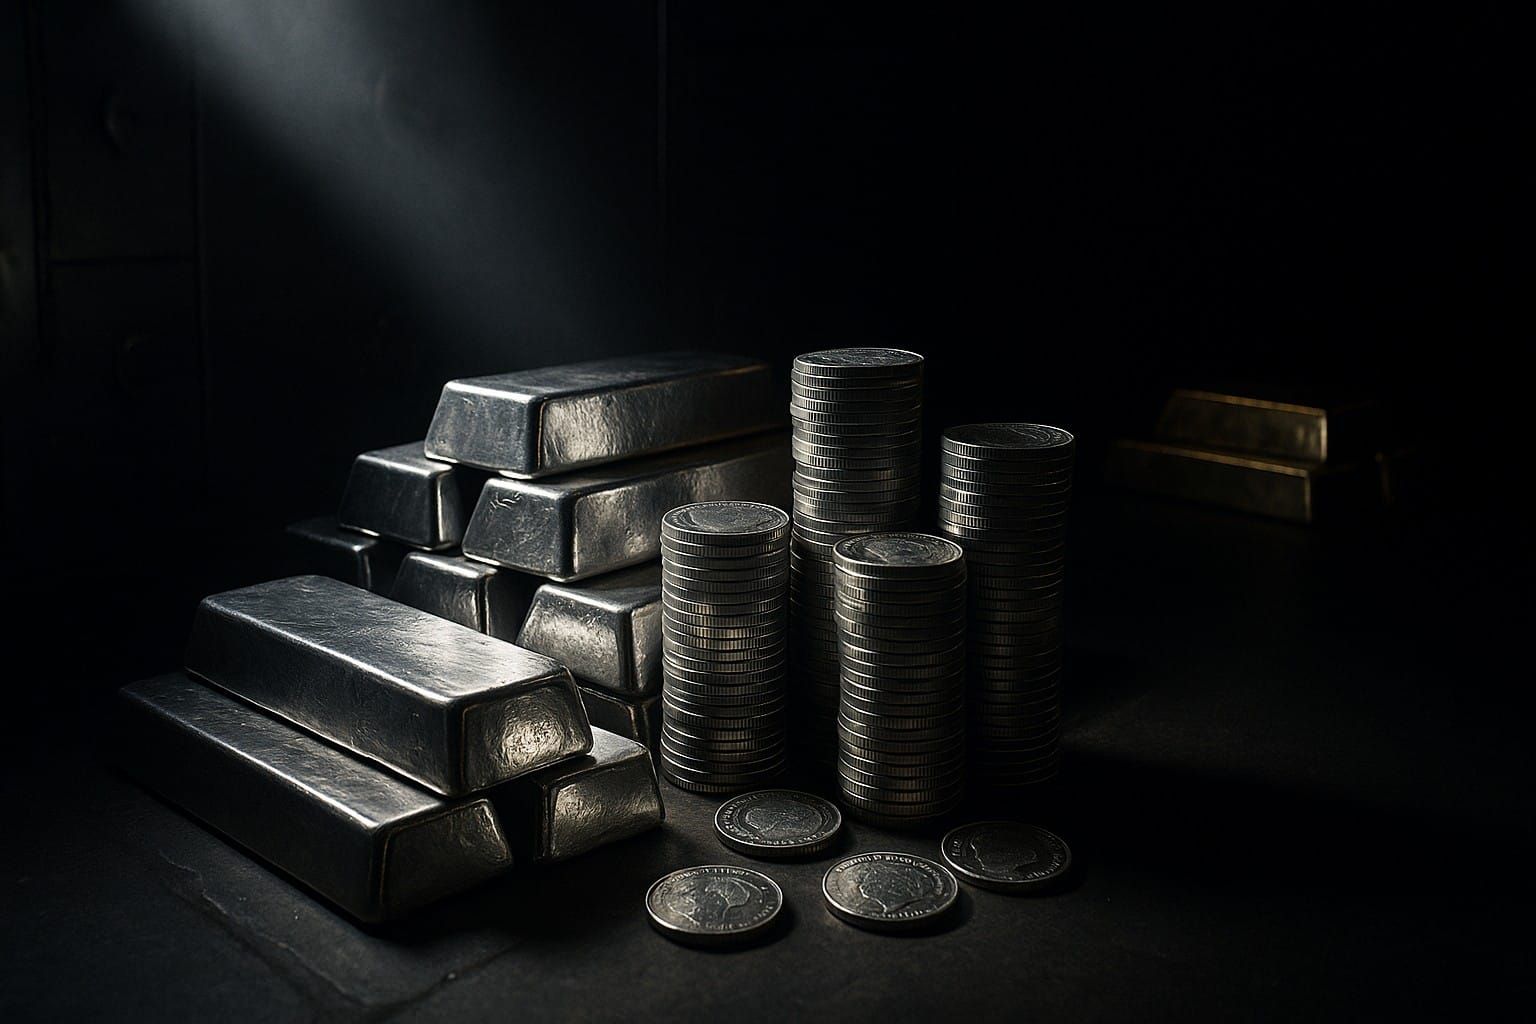
Gold set the record. On Wednesday morning, spot gold traded near $4,190 an ounce, up 2.78% on the session and hovering just under its all-time high. That is the number the headlines chase. It is also the number that tells you almost nothing about where the next trade in precious metals is.
For that, look one row down on the screen. Spot silver was trading around $61.60, up 3.71% — outrunning gold on the day, as it has for most of the past two weeks. The metal that spends most of the cycle as gold's poorer, twitchier cousin is quietly leading it.
That is not a coincidence. It is what silver does when the macro regime turns, and the regime is turning right now — ten days after a Federal Reserve that told markets, in the plainest terms it could manage, that it had no intention of cutting.
The Fed Said No. The Data Is Saying Otherwise.
On July 29, the Warsh Fed held the federal funds target at 3.50%–3.75% in a 9–3 vote. The dissents wanted a hike. Chair Kevin Warsh's press conference leaned hard into that hawkish tilt: inflation still runs above the 2% target, and the committee, he signaled, is content to let elevated market rates do part of its tightening work. The message markets took away was higher for longer, and don't rule out one more hike.
Then the data started arriving, and it did not cooperate.
- June job openings slipped to 7.36 million from 7.54 million — the labor market loosening at the margin.
- June factory orders contracted 0.3% — the goods economy stalling.
- ADP reported private employers added just 44,000 jobs in July — a number that, if Friday's official payrolls confirm it, reframes the entire "one more hike" debate.
Add a softer dollar (the DXY slipped just under 100), a 10-year Treasury yield easing back toward the 4.6% area, and a Strait of Hormuz de-escalation trade pulling Brent crude down toward $80 — cooling the oil-led inflation impulse that gave the hawks their cover in the first place.
Put together, the market is no longer trading the Fed's words. It is trading the Fed's next move — and repricing it away from a hike, toward the cut nobody on the committee will yet admit is coming. Precious metals are the purest expression of that repricing, because their entire bull case is lower real rates and a weaker dollar.
Briefings like this land in members' inboxes before the market prices them in. Join free →
Why Silver, and Not More Gold
Gold has already made the move. At $4,190, it is up roughly 60% over twelve months, richly owned by central banks and, increasingly, by every generalist fund that missed the first leg. When a trade is that crowded and that extended, the marginal dollar of the same thesis looks for a cheaper, higher-beta way in.
That is silver's structural role. It rides the same two macro drivers as gold — real rates and the dollar — but with a smaller, thinner, more violent market. When the precious complex catches a bid, silver lags at first and then overshoots. In the 2010–2011 cycle it ran from $18 to nearly $50. In 2020 it doubled off the COVID low while gold rose a fraction of that.
And silver carries a second engine gold does not have: industrial demand. More than half of annual silver consumption is industrial — solar photovoltaics above all, plus electronics and electrical contacts — and the Silver Institute has now recorded multiple consecutive years of structural supply deficit, with above-ground inventories drawing down. Gold is a monetary metal. Silver is a monetary metal and a critical input to the energy transition, which means it gets bid by two different buyers who rarely show up at the same time. Right now, both are.
The single cleanest way to see the setup is the gold/silver ratio — how many ounces of silver it takes to buy one ounce of gold. At $4,190 gold and $61.60 silver, that ratio sits near 68. That is elevated. In precious-metals bull markets the ratio compresses hard — it fell toward the low 40s in 2011 and the low 60s repeatedly in past rallies — because silver, once it moves, moves faster than gold. A high ratio in a rising market is not a warning. It is a coiled spring.
Which raises the only question that matters for positioning: if the ratio compresses from here, exactly how much silver upside does that imply — and which vehicles capture it without handing back the gain in the next volatility spike?
The rest of this briefing is for paid members: the scenario-by-scenario silver price zones as the gold/silver ratio compresses, the specific ways to own the move — physical, streamers, and the miners — ranked by risk and beta, the technical levels that confirm or kill the trade, and the bottom-line positioning framework.
AlphaBriefing Paid gets you every investment thesis, scenario framework, and catalyst brief we publish — the analysis private intel clients pay four figures for, at a fraction of that.